010-ant design pro advanced 图表
一、概述
原文地址:https://pro.ant.design/docs/graph-cn
Ant Design Pro 提供了由设计师精心设计抽象的图表类型,是在 BizCharts 图表库基础上的二次封装,同时提供了业务中常用的图表套件,可以单独使用,也可以组合起来实现复杂的展示效果。
目前一共包涵 10 个图表类型,以及 2 个图表套件:
-
饼状图(Pie)
-
柱状图(Bar)
-
仪表盘(Gauge)
-
雷达图(Radar)
-
标签云(TagCloud)
-
水波图(WaterWave)
-
迷你柱状图(MiniBar)
-
迷你区域图(MiniArea)
-
迷你进度条(MiniProgress)
-
带有时间轴的折线图(TimelineChart)
-
图表卡片(ChartCard)
-
图表字段(Field)
二、详细
2.1、使用 Ant Design Pro 的图表
Charts 图表套件是在 components/Charts 包中,引用到项目就像使用其它组件一样:
你也可以通过单独使用 pro 的包的方式使用图表组件:独立使用 Pro 组件
import { ChartCard, MiniBar } from ‘components/Charts‘;
import { Tooltip, Icon } from ‘antd‘;

const visitData = [
  {
    x: "2017-09-01",
    y: 100
  },
  {
    x: "2017-09-02",
    y: 120
  },
  {
    x: "2017-09-03",
    y: 88
  },
  {
    x: "2017-09-04",
    y: 65
  }
];

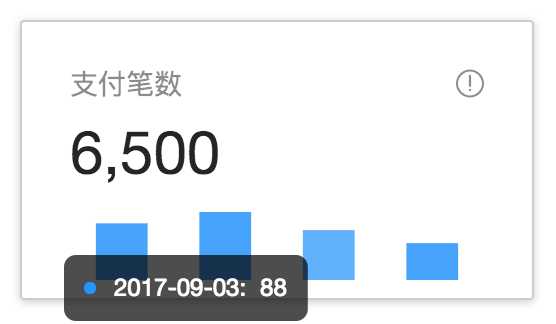
ReactDOM.render(
  <ChartCard
    title="支付笔数"
    action={
      <Tooltip title="支付笔数反应交易质量">
        <Icon type="exclamation-circle-o" />
      </Tooltip>
    }
    total="6,500"
    contentHeight={46}
  >
    <MiniBar height={46} data={visitData} />
  </ChartCard>,
  mountNode
);
就可以实现一个最简单的图表组合:

2.2、使用 BizCharts 绘制图表
如果 Ant Design Pro 不能满足你的业务需求,可以直接使用 BizCharts 封装自己的图表组件。
2.2.1、引入 BizCharts
通过 npm 安装
npm install bizcharts --save
在项目中使用
import { Chart, Axis, Tooltip, Geom } from ‘bizcharts‘;

const data = [...];

<Chart height={400} data={data} forceFit>
  <Axis name="month" />
  <Axis name="temperature" label={{ formatter: val => `${val}°C` }} />
  <Tooltip crosshairs={{ type : "y" }} />
  <Geom type="line" position="month*temperature" size={2} color={‘city‘} />
  <Geom type=‘point‘ position="month*temperature" size={4} color={‘city‘} />
</Chart>
参看 更多 Demo。
文章来自:https://www.cnblogs.com/bjlhx/p/8975947.html